If you’re a baseball fan who’s consumed baseball media for a long time now, you might be familiar with the phrase, “tough out.” A batter who’s a tough out is someone who can do a lot of different things to avoid getting out. This resiliency can come in the form of working counts, swinging at good pitches, and/or just being a great (some might even say “clutch”) hitter. But what I’ve come to realize as I’ve watched baseball more and more is that the degree to which someone is a “tough out” is quantifiable, and it’s not even that analytical. It’s on-base percentage.
Obviously on-base percentage doesn’t show a player’s entire skill at the dish, mostly because no single stat does (I’m looking at you, WAR), but it’s a simplistic way of showing how many outs a player saves. And no, I’m not trying to get fancy with the definition of the word “out.” I mean “out” in the most general sense; when one of the little circles on a scoreboard next to the letter “O” is filled in, that’s an out. On-base percentage is calculated by adding up the amount of walks, hit by pitches, and hits a player accumulates and dividing that sum by their total plate appearances minus their total sacrifice hits. Based on this formula, you can subtract a player’s on-base percentage from 1 (1.000, if you want to get technical) and come up with a newly-invented and not-at-all proven stat that I’m calling outs percentage, or the percentage that a player’s batting outcome ends in an out.
I wouldn’t go around dropping outs percentage numbers at your next baseball argument if I were you (but you can certainly reference ERAA and expect mildly satisfying results), but the tangibility of this stat can help explain why the notion of not getting out is so paramount in the game of baseball. Unlike football, basketball, hockey, and even soccer, baseball is not timed. There is no “race against the clock” or “two-minute drill” that decides the outcome of baseball games. Instead, each team has 27 outs, three per inning over nine innings, to score as many runs as possible and limit as many runs as possible. The commodity that baseball teams are searching for more of is outs. The more outs you have at your disposal to lose, the more opportunities you have at your disposal to score runs. It goes without saying, however, that teams are not trying to manufacture more chances by limiting the outs they commit. That’s a pretty weird way to describe the strategy of fielding a baseball team. Instead, teams are trying to manufacture wins by manufacturing runs. The fewer outs a team makes, the more runs they can score, and, more likely than not, the more games they can win. I’m sort of all over the place right now, but my point is that making an out is bad, and not making an out is good. Phew. I finally got there.
It should be noted in this argument that on-base percentage isn’t the greatest stat in the world because all baseball stats have their faults. OBP’s main fault is the same as the other two triple-slash statistics, batting average and slugging percentage, in that the weights of magnitude assigned to each non-out outcome is disproportionate to the value that said outcome provides. What I mean by that is a single is worth less than a double, unlike what batting average and OBP might say in their calculations, but not twice as less valuable, unlike what slugging percentage might say. Still, the benchmarks we associate with these “neanderthal, Stone Age” statistics, so to speak, are valid when it comes to explaining the success of a team. There’s no doubt that a high on-base percentage lineup is a darn good lineup, and sure, a stat like weighted on-base average (or wOBA) might tell the story a little differently (wOBA is basically slugging percentage with more accurate run-scoring weights, that’s then normalized to be on the same scale as OBP), but it takes away the easy-to-understand story of on-base percentage: getting out is bad, no matter what.
When push comes to shove, no one is going to be asking if one player should’ve been batting in a certain situation because they have a higher on-base percentage than another batter (because the conversation would much more likely be reserved for batting average or slugging percentage), but I want to bring up a story that I think summarizes the idea of an above-average OBP being indicative of a tough out. The Yankees were playing the Mariners in a four-game series last summer in August in the Bronx. I attended the second game of that series with my high school friends (it was Gerrit Cole Top Gun Bobblehead Night) and sat through nine brutal innings with the game tied at one. After each team scored in the tenth and the Mariners were shut out in the top of the eleventh, the Yankees were in a prime position to win the ballgame. Then, with two outs in the frame and Joey Gallo at second base, Brett Gardner stepped to the plate.
I’ve always hated Brett Gardner. Like, truly despised him. I know a lot of Yankees fans love him, but to me, he always seemed like a liability to the team, even in his younger years. Then I started listening to Yankee broadcasts more attentively and picked up on why Gardner would never just fade away. With his slap-happy swing (literally) that fouled off bad pitch after bad pitch and an eye that would get a ten out of ten from any optometrist, Brett Gardner was the definition of a tough out, which, by the time that he came up in the bottom of the eleventh against Seattle, became a joke among my friends. In previous at-bats that game and in countless others throughout the 2021 season, Gardner would get himself into 0-2 counts, which would make the average fan nervous. Not me and my friends. If you thought you had Bretty Ballgame beat on an 0-2 count, you were sorely mistaken. Brett Gardner ended that game against the Mariners with a walk-off single. It was the first walk-off I’d ever seen live.
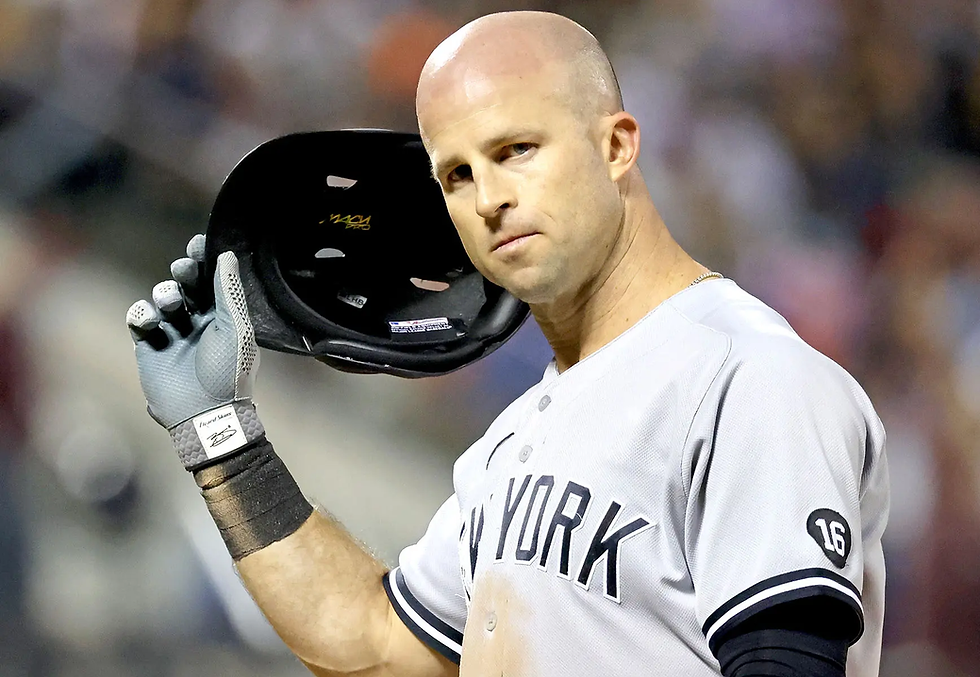
The Gardy Party that night was indeed fun, but the confidence that my friends and me had in Brett Gardner to not get out in a big spot is just a microcosm of Gardner’s hitting approach. He was a fighter at the plate, a true veteran hitter, and his on-base percentage shows. Gardner batted a paltry .256 for his career with a stellar lifetime on-base percentage of .342. Hall of Famer Tony Perez batted .279 lifetime and had a .341 career OBP. Am I saying that Brett Gardner was better than Tony Perez? No. Am I saying he got out fewer times on a percentage basis? Unequivocally so. Am I also saying that, in a weird way, this is objectively a good thing? See Answer #2.
Comentários